Assignment/Pin-up 3
Assignment 3
You are given a specific UBC campus site: the Robert H. Lee Alumni Centre and the Money & Raymond Lee Square (the plaza in front of the Alumni Centre).
Your task: choose one of three design tracks, develop a site analysis, and produce a conceptual design that responds to driving forces you identify on the site.
You are expected to borrow and adapt a parametric formand evolve it so the design is shaped by site-specific data rather than arbitrary parameters. This pattern can come from anywhere: your own group's Assignment 1 script, another group's A1 script (all Grasshopper definitions will be posted on Canvas), any case study from this course, or a pattern you find or design yourself. You are free to design a new pattern from scratch or adapt an existing one — the point is that the pattern must respond to a real site condition.
What changes from A1 to A3:
For a facade — A1: "The louver rotates because I set a slider." → A3: "The louver rotates because this zone receives 1,200 kWh/m²/yr of solar radiation and needs to block afternoon glare."
For a landscape — A1: "The paver size varies because of an attractor point." → A3: "The paver size varies because this is a high-traffic zone near the café entrance and wider joints allow tree roots and stormwater infiltration."
For a pavilion — A1: "The opening size changes along the surface." → A3: "The openings face south and widen toward the west to frame the afternoon sun while sheltering the seating area from prevailing wind."
This is an individual assignment.
The Site
The Robert H. Lee Alumni Centre sits at the intersection of pedestrian circulation between the Student Nest, the Bus Loop, and University Boulevard. The west and south facades face the public square and receive significant solar exposure. The square is primarily a transit zone with trees — a space people move through between the Nest, the bus exchange, and University Boulevard, with some informal gathering and seating along the edges.
[Your Rhino context model (from Exercises 7 and 8) must cover at least 250 × 250 m of the UBC campus centered on this site.] (Update: the size is not required any more) The context model does not need to be detailed — massing volumes and terrain are sufficient. The detailed modeling effort should go into your design, not the surrounding buildings.
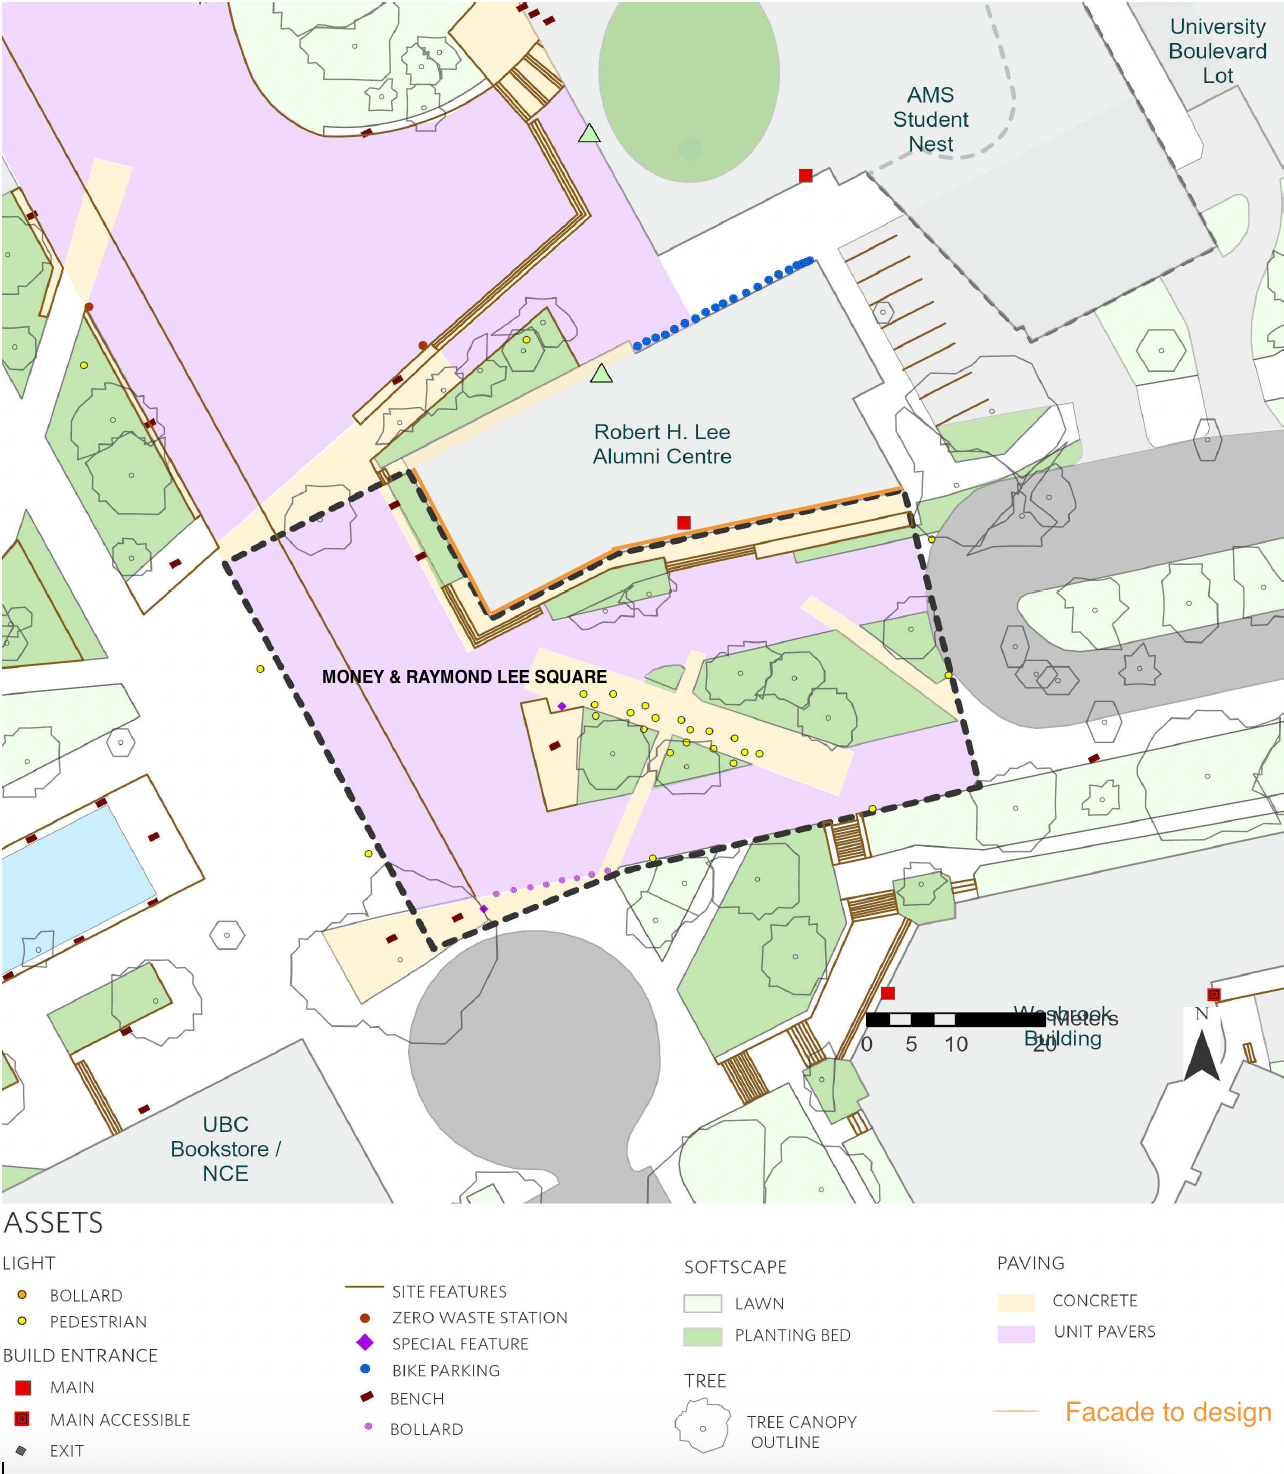
Three Design Tracks
Choose one of the following:
Track A: Facade Redesign
Design a parametric facade system for the west and/or south face of the Alumni Centre. Your pattern logic should respond to site forces — solar radiation, wind direction, pedestrian visibility, interior program adjacency, or other forces you can justify.
Track B: Landscape / Plaza Redesign
Redesign the Money & Raymond Lee Square ground plane — paving patterns, planting zones, seating, circulation, or topography — using parametric logic driven by site forces such as solar exposure, outdoor comfort, pedestrian flow, or stormwater. Since the square is relatively far from surrounding buildings, your forces will likely come from the ground condition itself: sun/shade patterns, existing trees you choose to keep, existing paths and desire lines, or the relationship between the Alumni Centre program and outdoor use.
Track C: Pavilion in the Square
Design a small pavilion or canopy structure sited within Money & Raymond Lee Square. The form and/or surface treatment must respond to site forces. The pavilion should be a freestanding structure with a clear spatial enclosure or shading function.
Driving Forces
Your design must respond to at least one driving force. You can choose to work with multiple forces if it supports your design intent. However, your design cannot rely solely on internal forces — at least one of your driving forces must be an external site or environmental condition.
A driving force does not have to be digitally measured data. It can come from your own site survey, your own observation, or your own interpretation of how the site is used. What matters is that you can clearly explain: "This parameter changes because of this force," and show evidence of that force — whether it's a Ladybug radiation map, a hand-drawn circulation diagram from your own site visit, a photo survey, or a programmatic analysis of the building.
Required: Regardless of which additional forces you choose, the Ladybug solar/climate analysis from Exercise 3.2 must be integrated into your submission. It can be the primary driver of your design, or it can appear as a supporting data layer in your site analysis — but it must be present.
Forces can be external (coming from the site and environment) or internal (coming from the building, structure, or program itself).
External forces:
- Solar radiation — from Ladybug analysis (kWh/m²)
- Pedestrian circulation — mapped from your own observation, desire lines, or OSM data
- Wind exposure — from climate data or site observation
- View / visibility — what passersby see from different angles
- Microclimate comfort — shade, wind, temperature zones
- Stormwater / drainage — topography and flow patterns
- Personal survey or site observation — your own data collection on how people use the space
Internal forces:
- Interior program — what happens behind each facade zone (study, café, event, office) and how that changes what the skin needs to do
- Structural performance — load paths, span conditions, or material efficiency shaping the geometry (as discussed in L3.2)
- Program organization — how spaces are arranged, where entries and circulation occur, and how the design mediates between inside and outside
- Daylighting / thermal performance — how much light or heat each zone needs
Phasing
Phase 1: Site Analysis
Build your site analysis through Exercises 7 and 8. This includes the UBC context model, GIS/OSM data import via Caribou, and Ladybug solar radiation analysis. Map your chosen driving force(s) as data layers.
In the exercises, you will submit screenshots directly from Ladybug/Grasshopper. For the assignment, you need to properly represent and compose these analyses as part of your portfolio.
Phase 2: Parametric Design
Develop your design using Rhino and Grasshopper together. You do not need to generate the entire design parametrically in one Grasshopper definition — you have the freedom to move back and forth between Rhino and Grasshopper. For example: manually design the overall form in Rhino and use Grasshopper to apply a parametric panel or paver system, or use Grasshopper for form-finding and manually refine details in Rhino. The key requirement is that at least one aspect of the design is parametrically driven by your site force data, and the design must show a clear response to the site forces — not a uniform pattern.
A resource library from Assignment 1 is available in Files / Resource Library, or here: $CANVAS_COURSE_REFERENCE$/files/folder/Resource%20Library%20-%20A1
Phase 3: Representation
Use generative AI tools to produce your portfolio visuals — you are not expected to manually render. Nano Banana, Google AI Studio (education credit), or similar tools are all encouraged. Compose a 4-page portfolio as described in Deliverables below.
Optional: Optimization & Fabrication
If you want to push further, you may explore:
- Galapagos optimization (T3.3) — optimize a design parameter for a measurable goal and document before/after with a fitness graph
- Robotic fabrication (T2.3) — consider how your design could be fabricated
These are optional explorations, not required and not graded separately.
Deliverables
4-Page Portfolio (11×17" Landscape, PDF)
Your portfolio must include the following minimum required drawings. How you distribute them across the four pages is up to you.
Minimum required drawings:
- An exploded axonometric diagram showing the site analysis at your chosen scale — context, data overlays (radiation, circulation, or other forces), and the relationship between layers
- A generative process diagram showing the data-to-form pipeline: Force → Data → Parameter → Geometry
- An annotated Grasshopper screenshot showing the workflow
- at least 2–3 rendered views of the design in context, showing the variation clearly
- A short statement (max 150 words): what force drives the design, how data is mapped to geometry, and what the design achieves
Files:
- Grasshopper definition (.gh) — annotated with groups and labels
- Rhino model (.3dm)
- 4 page portfolio (.pdf)
- Miro board upload
Grading Criteria
| Category | Weight | Description |
|---|---|---|
| Site Analysis & Data Reading | 20% | Quality of context model, Ladybug analysis, data mapping, and identification of driving forces |
| Parametric Logic & Data-to-Form Rigor | 30% | Clear, traceable connection between data and geometry; clean Grasshopper definition; meaningful adaptation of pattern logic |
| Design Quality | 30% | Visual coherence; clear response to site forces; does the design look like it was shaped by the data? |
| Representation & Communication | 20% | Portfolio clarity; composed renderings; legible generative process diagram |
Timeline
- Work Session (April 1): Miro Pin-up to get feedback; Instructor + TAs available for technical support.
- Miro Pin-up: https://miro.com/app/board/uXjVGnmJ_uk=/?share_link_id=440929736582; Password: [password redacted — available from the instructor]
- Final Canvas Submission (April 15): Due 11:59 PM.